BTC market review in the context of Bitcoin-ETF adoption
- Jan 11, 2024
- 3 min read

📈 Technical analysis BTC/USDT
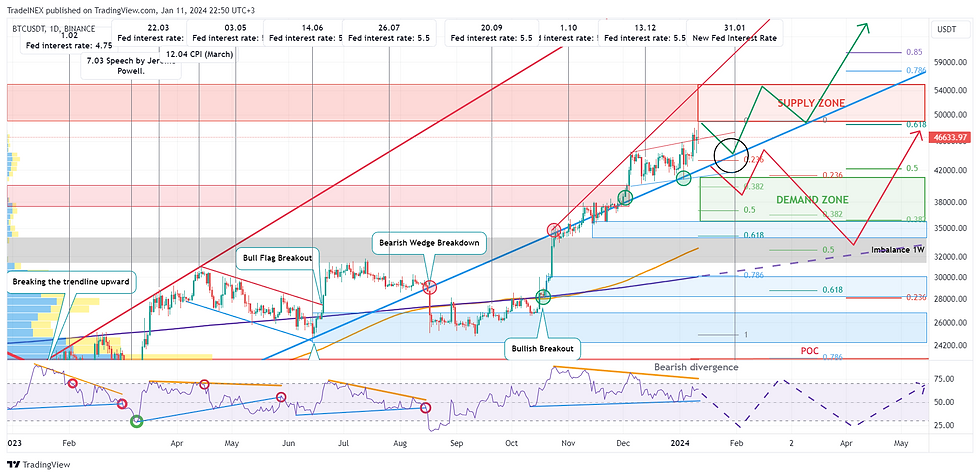
After the approval of the Bitcoin spot ETF, the price of BTC broke out of the parallel price channel and updated its local maximum to the level of 49,000, where its growth was halted by a significant resistance block. The lack of active Bitcoin growth surprised many market participants, but this can be explained by the fact that the approval of spot BTC ETFs was already factored into the price due to market expectations. The market had long been fueled by news, and major players had invested in Bitcoin before the SEC's final decision.
A bearish divergence has formed on the RSI indicator on both 1-hour (1H) and 1-day (1D) charts. Therefore, in case sellers manage to push below the dynamic support line EMA50 on the 1-hour chart, we expect the continuation of a local correction in the range between the 0.5 - 0.78 Fibonacci correction levels. There, the Point of Control (POC) and the 1-day imbalance zone are located, where gaps in horizontal levels of trading volumes need to be closed. The nearest significant support block, from which a rebound may occur, is at levels 44000-45000.
To continue the rise in the price of Bitcoin, it needs to consolidate above the upward trendline of resistance. In the event that buyers manage to overcome significant resistance blocks at 48000-50000 and 52000-53000, the upward trend may continue.
📉 Bitcoin market global analysis
The price of Bitcoin has reached exactly the 0.68 Fibonacci correction level from the entire decline since reaching the all-time high (ATH) in 2021. The next target for growth is the 0.78 Fibonacci level. But there is a significant resistance block is situated on the way in the range of 48000-53000.
However, it's worth noting that almost uninterrupted upward movement has persisted for the past three months. The RSI indicator readings are in the overbought zone, increasing the likelihood of a local correction before the continuation of the upward trend. If, under selling pressure, the price consolidates below the level of 38500, we can anticipate a correction in the range of 0.38-0.5 Fibonacci levels and a retest of the 200-week moving average. A retest of the global ascending trendline might occur there. Additionally, there is the 1-week Imbalance zone at 34000-31000 where needs to close gaps at horizontal levels of trading volumes.

💠 Analysis of zones and levels for making trading decisions
The Fear and Greed Index is in the extreme greed zone at 76.
The total market capitalization of the cryptocurrency market has increased to 1,725 billion dollars, and the Bitcoin dominance index has risen to 52.6.
According to the analysis of the accumulation of large order blocks in exchange order books, demand and supply zones are located at the following levels:
🟢 Demand Zone: 35000 - 41000
🔴 Supply Zone: 48000 - 53000
Levels for long positions:
44000-45000 - large support block
37000-41000 - largest support block
34000-35000 - zone of possible retest of the trend line
30000-31000 - zone of possible retest of the 200-week moving average
Levels for short positions:
48000-50000 - large resistance block
42000-53000 - large resistance block
57000 - 0.78 Fibonacci retracement level
📊 Fundamental analysis
On Wednesday, January 10, 2024, the U.S. Securities and Exchange Commission (SEC) approved the first-ever Bitcoin spot ETFs in the United States. On that day, a large volume of BTC was transferred to exchanges, likely with the intention of subsequent sales. The behavior of major market participants may suggest that, in their view, the price of BTC is approaching a local peak. It's also important to note that ETFs will start accepting capital only when trading opens in the U.S., and all those wishing to participate in trading have already invested in BTC before the SEC's final decision.
🌐 Upcoming Events in the Global Economy
The following dates are expected to bring increased volatility in both the stock and cryptocurrency markets:
➤ January 25, 16:30 - U.S. GDP Data for the 4th Quarter of 2023.
➤ January 30, 17:00 - U.S. Labor Market Data - JOLTS for December 2023.
➤ January 31, 2024, 21:00 - New Fed Interest Rate Decision.


Comments